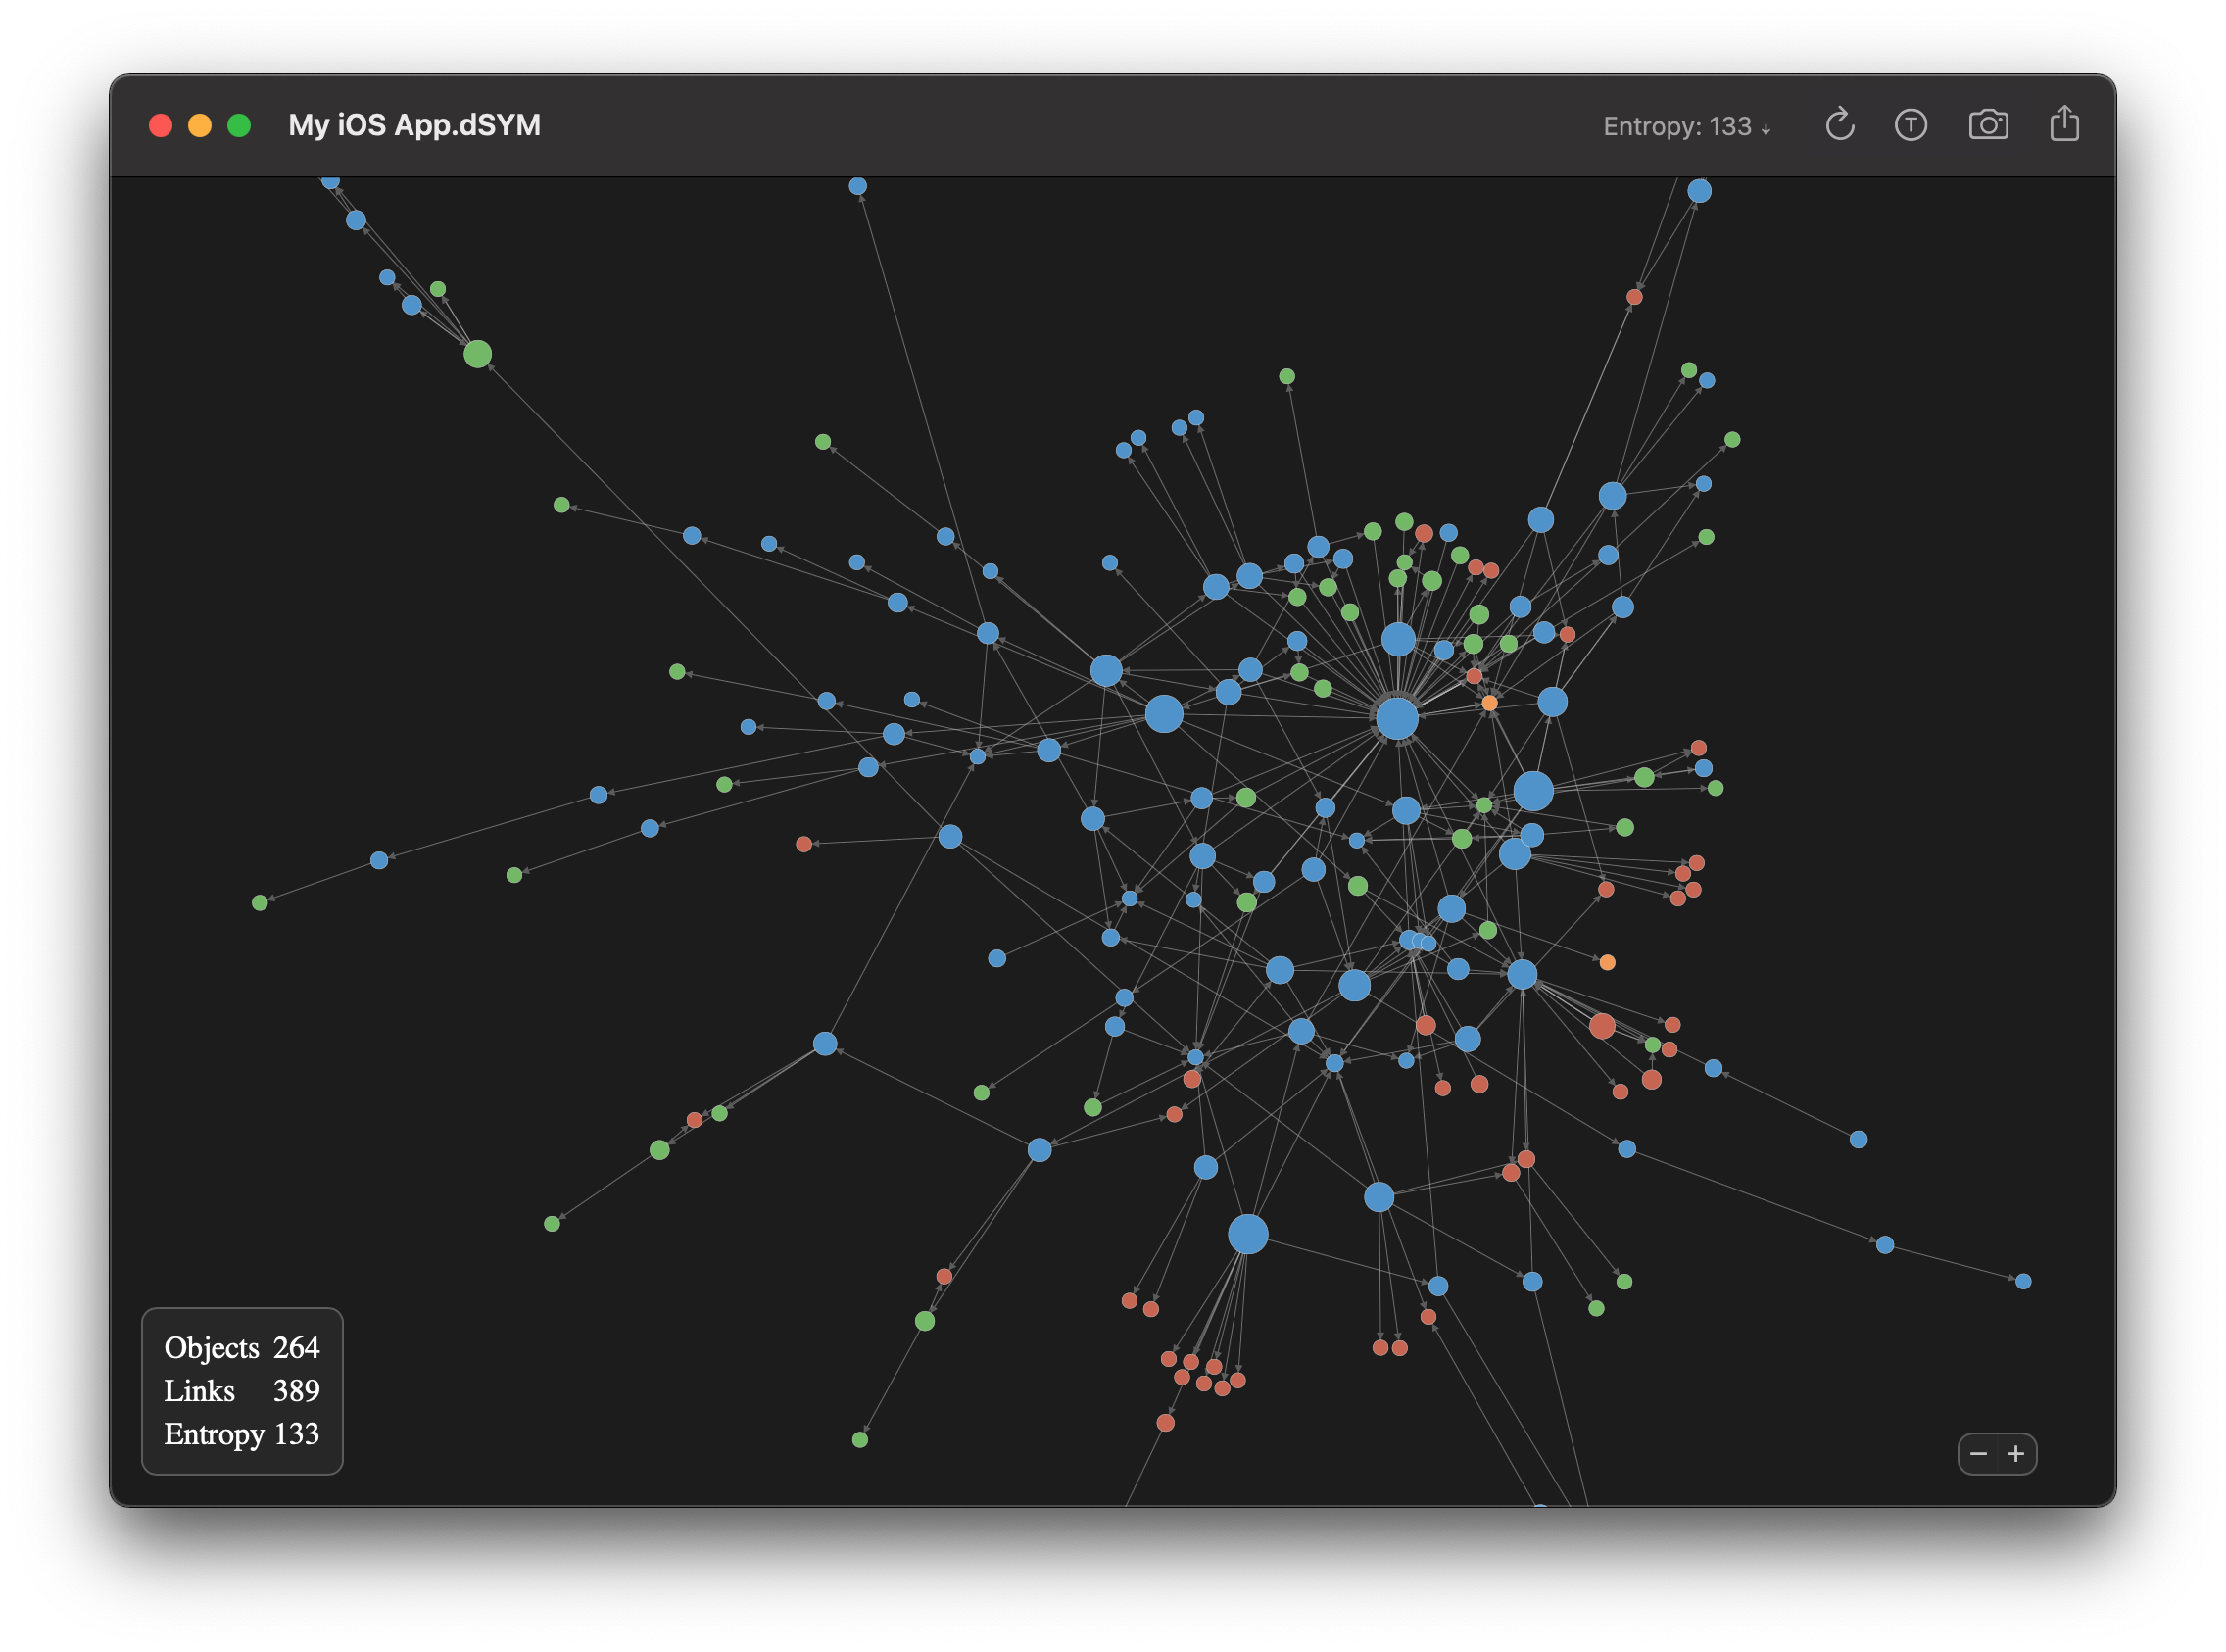
Thanks to a mathematical method we developed, you can obtain a score to objectively measure the complexity of your software. Read more details about the Software Entropy.
Dependencies lets you export and share the interactive graph. You can easily embed this graph on any website as HTML. This is a great way to visually document your architecture. Check it out and play with this interactive graph ⇨

Explore the architecture of your app.
Universal app optimized for Apple Silicon.
Share screenshots with your team.
Export the interactive graph as HTML.
Preview your dSYM files right from the Finder.
Generate interactive graphs from your CI.
Support iOS, macOS, tvOS, ARM, Intel, …
Fits right at home on macOS Big Sur.